The determination of the minimum sample size needed for a research study is largely a function of:
(1) desired confidence level, usually set at 95% (this is equal to the probability we are willing to accept that the observed result is not due to chance)
(2) standard deviation (this is the expected variance in the responses), and
(3) margin of error, also called the confidence interval (this is the maximum size of the difference between the true population parameter and the observed estimate of the parameter. It is sometimes reported as the +/- figure around a survey result.)
There are many formulas available for the calculation of minimum desired sample size. This formula is frequently used when the target population size very large or is unknown:
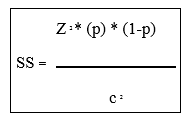
Where:
SS= Minimum sample size needed
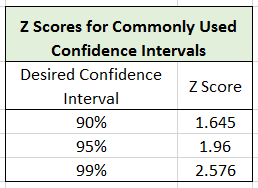
Z = Z value (Look up the Z value associated with the desired confidence level here)
p = standard deviation c = margin of error, expressed as decimal
For example, if our desired confidence level is 95%, Z = 1.96, and if we set the standard deviation to 0.5 and the margin of error at 0.03, then:
SS = 1.962*(.5 *.5) / .032 = 1067
What other factors effect the determination of minimum sample size?
The expected attrition rate should also be taken into consideration when determining your desired minimum sample size.
An attrition rate is the percentage of the sample that "falls out" of, or fails to progress through, a longitudinal survey over time. For example, if 5,000 first year university students agree to participate in a three year study and complete the first questionnaire and 3,000 students complete all three years of the study, then the attrition rate would be 40%. When planning a longitudinal survey, plan for sample attrition. If, in this example, your estimated minimum sample size was 5,000, the loss of 40% of respondents between the first and third data collection periods would have a detrimental impact on data analysis and interpretation.
Attrition should also be considered as a potential source of bias in your sample. Your data analysis team will need to compare characteristics and program-related factors of the attrition group compared with the rest of the respondents to investigate whether there are any differences between these two groups that may impact the survey findings.
The expected response rate should also be taken into consideration when planning your desired sample size. Simply defined, the response rate is the number of respondents who agree to participate in a survey (or a research study) divided by the total number of eligible respondents. Response rates from surveys of your target population or about a similar topic can be used to make a reasonable estimate of the proportion of people who sampled who will agree to participate. In practice, the calculation of a survey response rate involves a formula that includes distinguishing ineligible sampling units, non-contacts, refusals, partially completed surveys, and completed surveys.
The survey response rate, and its converse, the refusal rate, need to be analyzed by key target population characteristics and other factors related to desired program outcomes to detect any non-response, or refusal, bias in the sample.
Citations and Further Reading:
Selvin, S. (1996). Statistical Analysis of Epidemiologic Data. New York: Oxford University Press.